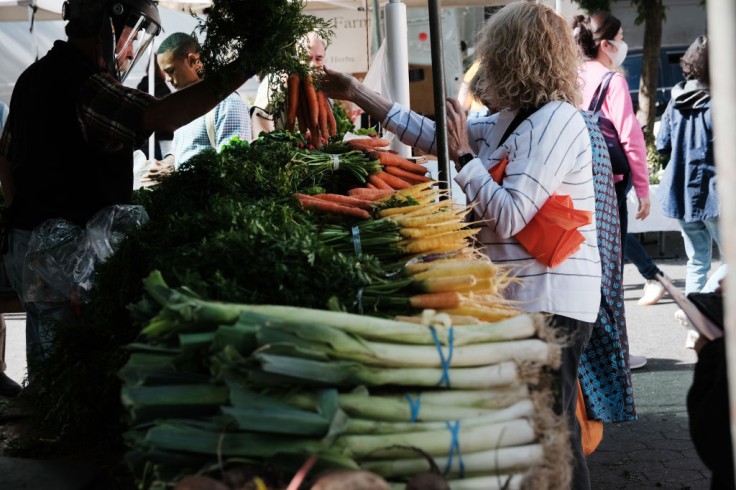
SNAP benefits have helped millions of low-income households across the country to meet their groceries and basic needs.
This program provides essential support for individuals whether for elderly people, single parents, or even for small and large families with children.
However, the food stamp payment amount that individuals receive can vary significantly depending on which state they are living.
This discrepancy in food stamp payments highlights the influence of state-specific factors and economic conditions on SNAP benefits.
Understanding State Variations in SNAP Benefits
SNAP is financed by the federal government but managed by state and local organizations, resulting in significant differences in monthly benefits nationwide.
Recipients can use electronic benefit transfer (EBT) cards to purchase essential groceries and receive these benefits.
Typically, each qualified individual in America gets around $212 per month in SNAP benefits. Nevertheless, this quantity can vary significantly depending on the state.
In 2023, Hawaii had the highest average monthly benefit of $445 per person, for instance. Alaska came next with a mean of $376, while Minnesota offered $261 monthly.
Conversely, Iowa had the smallest mean monthly assistance of $162, while Montana and Nebraska closely followed at $165 and $167, respectively.
Factors Influencing SNAP Payment Differences
Several factors contribute to the variations in SNAP benefits across states. The most significant include income levels, household expenses, household size, state demographics, and economic conditions.
- Income Levels: Higher household income typically results in lower SNAP benefits. States where cost of living is high often give out a much higher benefit to accommodate the expenses.
- Household Expenses: Certain expenses, such as housing and utilities, are deducted from the household income when calculating SNAP benefits. Higher expenses can lead to higher benefit amounts.
- Household Size: Larger households generally receive more benefits, reflecting the greater need for food assistance.
- State Demographics: States with higher living costs tend to offer higher SNAP benefits to meet the increased cost of essential groceries.
- Economic Conditions: States with struggling economies may have more residents qualifying for higher benefits due to lower income levels and higher unemployment rates.
SNAP Program Evolution and Participation Rates
Ever since SNAP was introduced, the program has adopted numerous changes as to how it helps people and the benefits it provides. This program started in 1964 and was gradually implemented countrywide in July 1974.
The SNAP program has undergone significant changes since it was first introduced. It started in 1964 and grew steadily, achieving complete countrywide execution by July 1974.
During that period, 12.9 million individuals, equivalent to 6% of the population in the United States, were recipients of SNAP benefits.
Involvement levels have varied due to economic circumstances and adjustments in qualification criteria.
During the Great Recession in 2013, the SNAP program handed out its highest payment benefits to people, reaching 18.8%. In addition, during the outbreak of the coronavirus in March 2020, SNAP beneficiaries nationwide grew significantly.
The sudden increase led Congress to grant extra benefits and temporarily halt work and training requirements throughout the public health emergency.
The number of individuals receiving benefits increased from 37.2 million in March 2020 to more than 43 million by September 2020.
Furthermore, New Mexico became the state with the highest registered beneficiaries of the program in July 2022.
On the contrary, Utah is the state that had the smallest percentage of beneficiaries at 4.6%, followed by New Hampshire (5.0%), Wyoming (5.1%), and North Dakota (5.8%) with similarly low rates.
SNAP benefits continue to be a crucial resource for numerous Americans, offering vital assistance to households with low incomes. The differences in benefits between states show how local economies affect the importance of the program in ensuring food security and promoting healthy lifestyles.